0
Skip to Content
Chirpy Bird, Inc.
Home
All Services
MIPS, MVP, and ASM
ACO
Compliance
CE/CME Classes
Blog
Services and On Demand Resources Shop
Policy Shop
Contact Us
About
MIPS Second Opinion
888-647-7247
Chirpy Bird, Inc.
Home
All Services
MIPS, MVP, and ASM
ACO
Compliance
CE/CME Classes
Blog
Services and On Demand Resources Shop
Policy Shop
Contact Us
About
MIPS Second Opinion
888-647-7247
Home
Folder: Our Services
Back
All Services
MIPS, MVP, and ASM
ACO
Compliance
CE/CME Classes
Blog
Folder: Shop
Back
Services and On Demand Resources Shop
Policy Shop
Contact Us
About
MIPS Second Opinion
888-647-7247
Colorful dice with "MGMA19 The Financial Conference" text over a black-and-white Las Vegas background.
Presentation slide titled "MIPS and APMs: Everything you Need to Know for 2019 and Beyond" at MGMA 19 conference, featuring speakers Robin Roberts and Joy Rios.
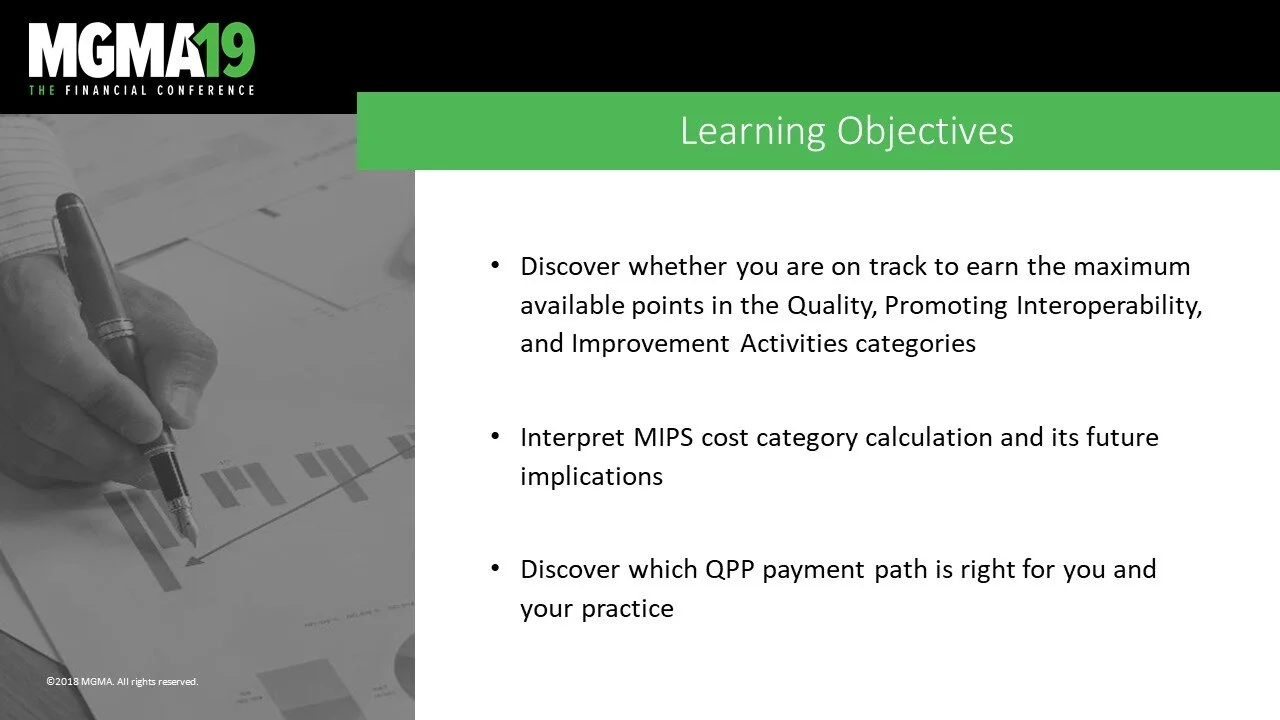
MGMA19 Financial Conference slide with learning objectives: assess MIPS points, interpret cost categories, and choose QPP payment path.
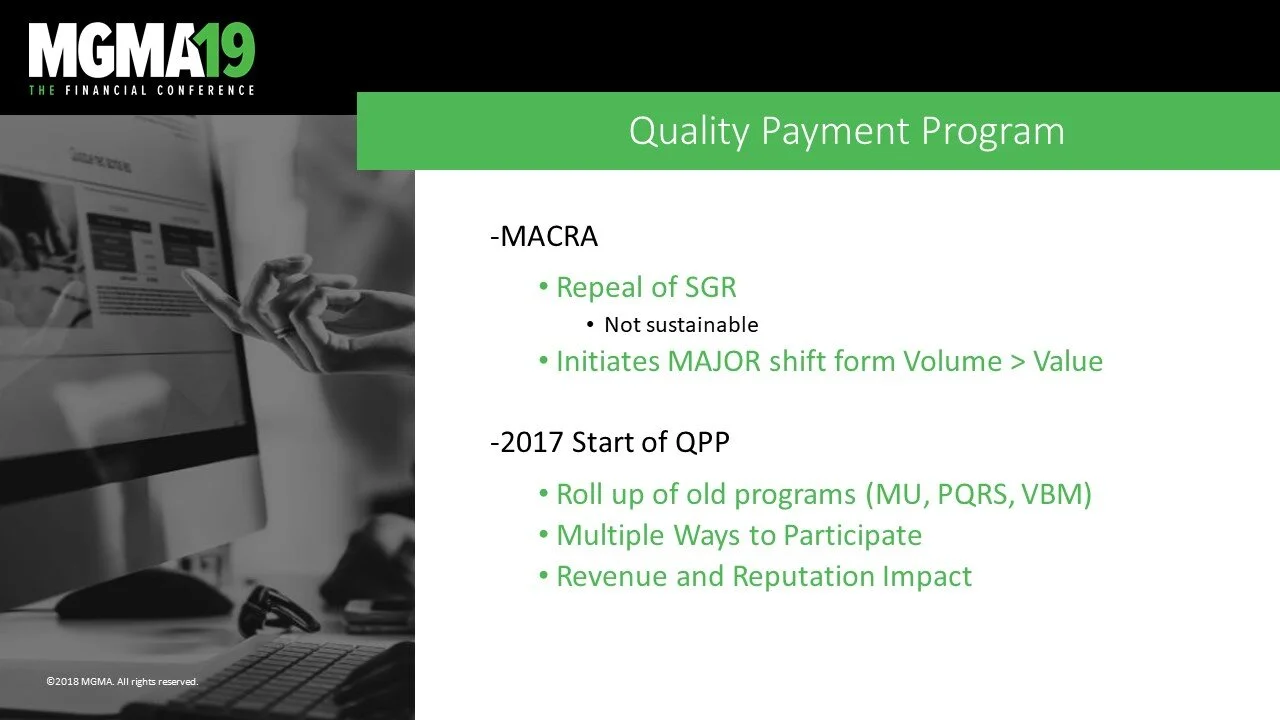
Slide from a presentation at MGMA19 conference about the Quality Payment Program, discussing MACRA and the start of QPP in 2017, with points on the repeal of SGR, shift from volume to value, and impact on revenue and reputation.
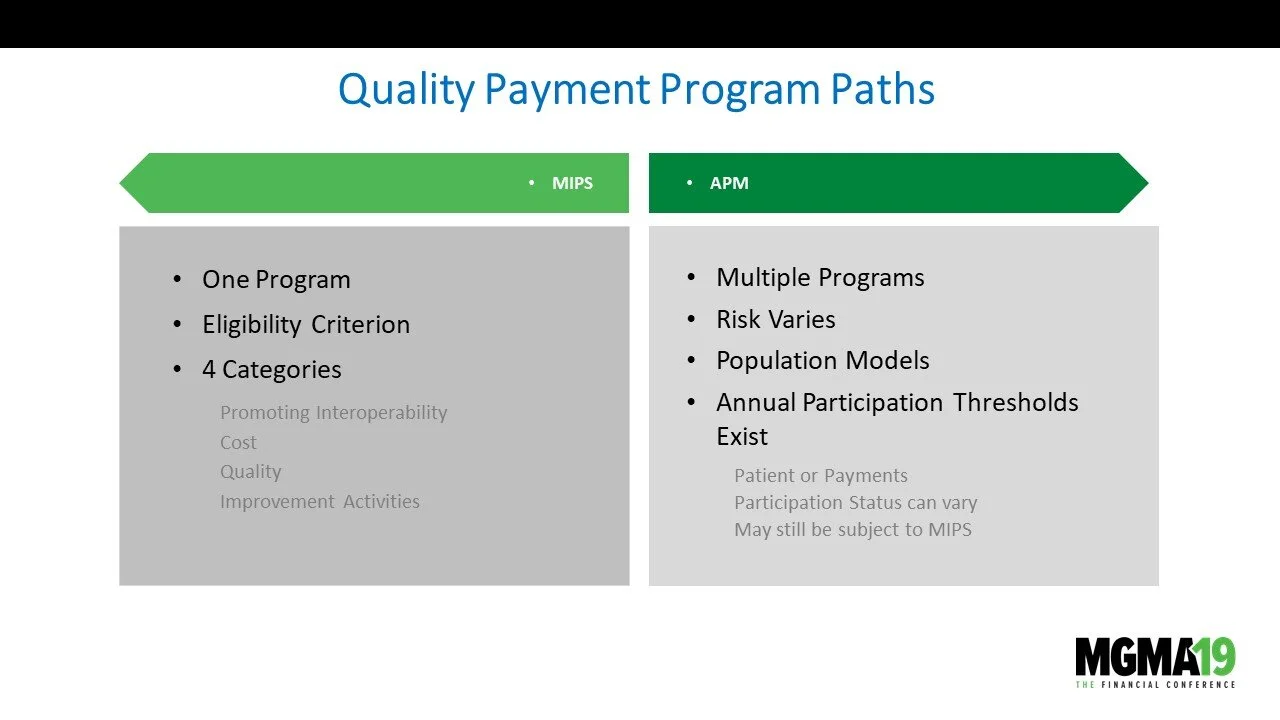
Slide titled 'Quality Payment Program Paths' with two columns. The left column labeled 'MIPS' includes points: One Program, Eligibility Criterion, Four Categories (Promoting Interoperability, Cost, Quality, Improvement Activities). The right column l
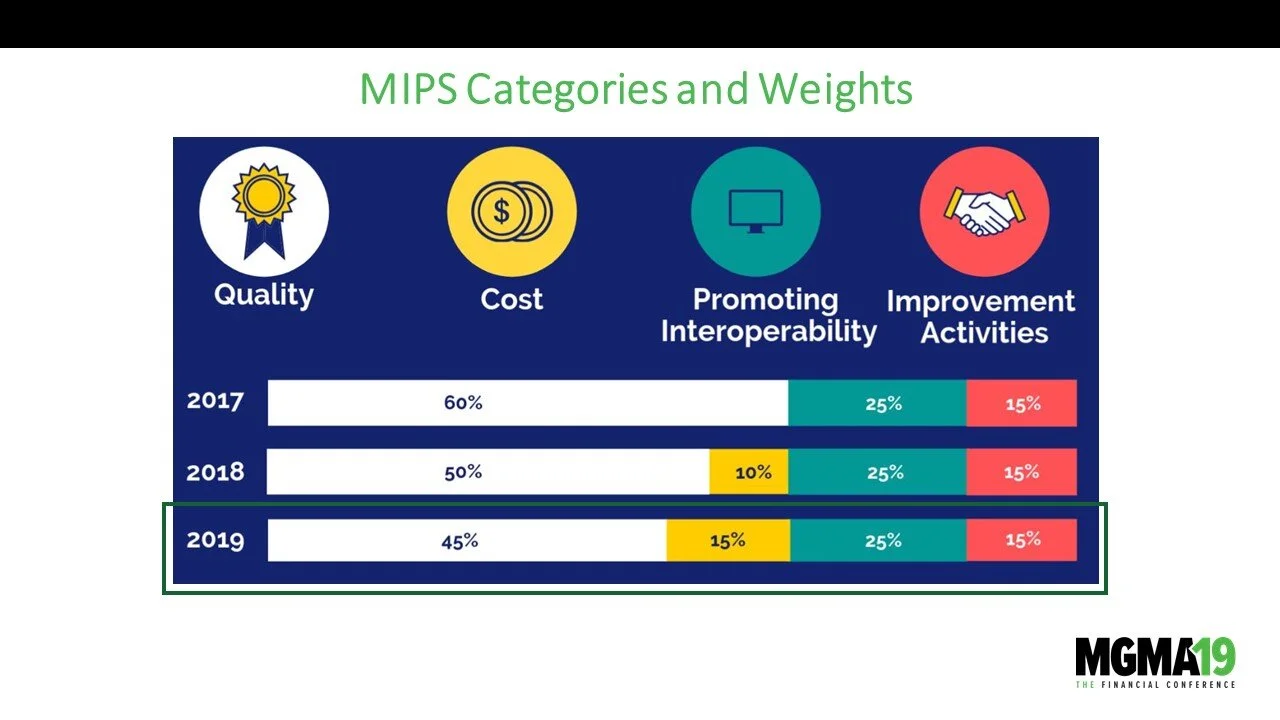
A chart titled 'MIPS Categories and Weights' shows data from 2017, 2018, and 2019. It includes four categories: Quality, Cost, Promoting Interoperability, and Improvement Activities, with respective percentages decreasing over the years for Quality a
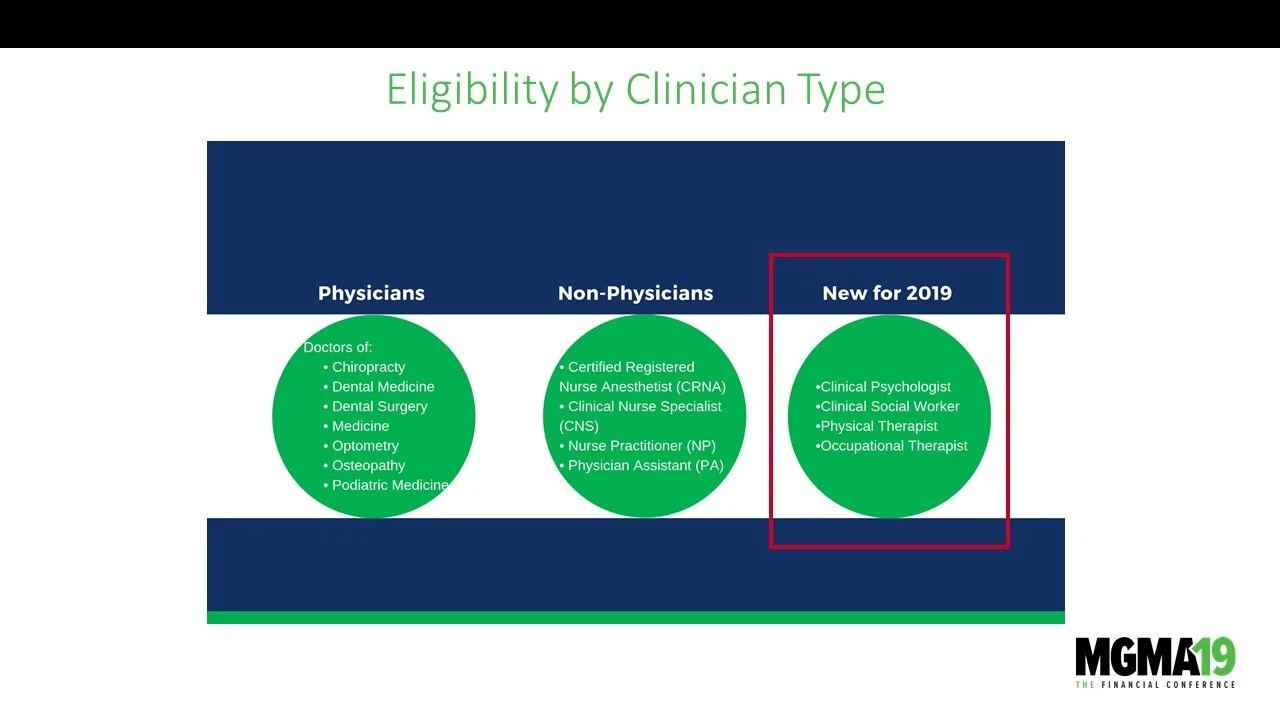
A chart titled 'Eligibility by Clinician Type' showing categories for physicians, non-physicians, and new roles for 2019, with lists of various healthcare professions under each category. The chart is from MGMA19, a financial conference.
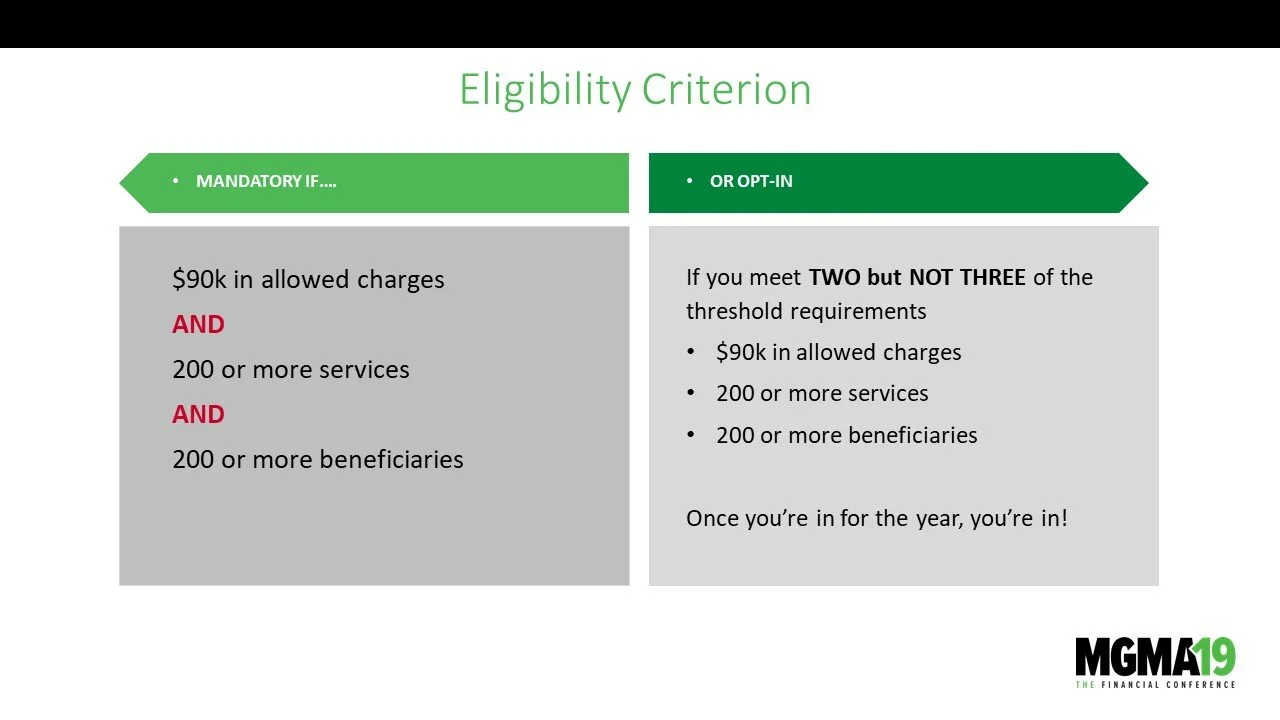
Slide titled 'Eligibility Criterion' with two sections: 'Mandatory' on the left, 'Or Opt-In' on the right. The slide discusses charge and service thresholds for eligibility. The bottom right corner features the MGA19 conference logo.
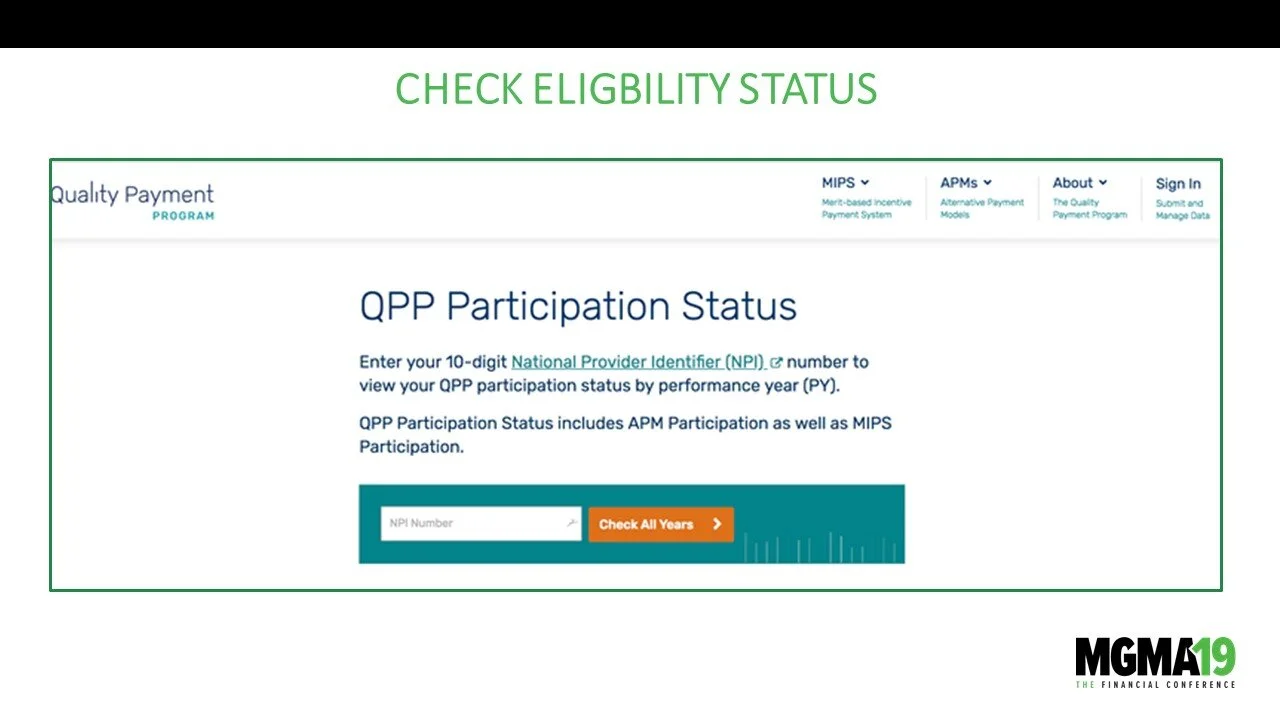
Screenshot of a government web page titled 'Check Eligibility Status' for the Quality Payment Program. It has a section labeled 'QPP Participation Status' with instructions to enter a 10-digit National Provider Identifier (NPI) to view participation
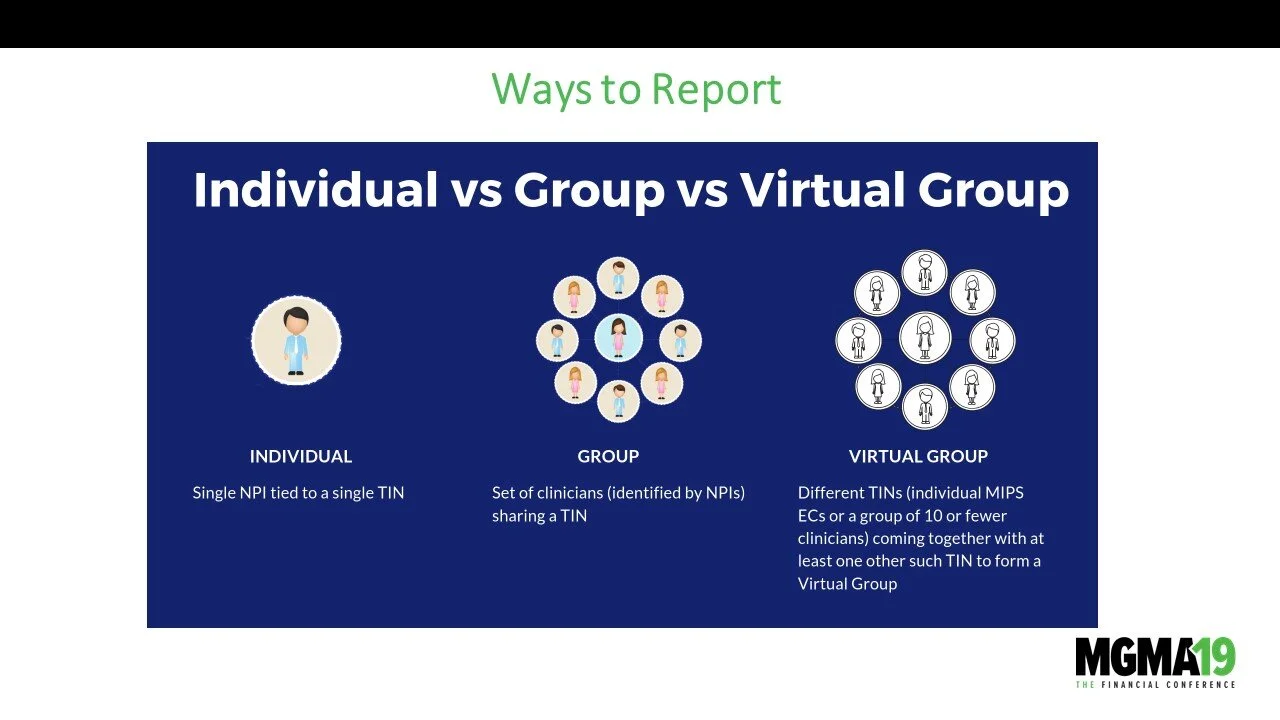
Infographic titled 'Ways to Report: Individual vs Group vs Virtual Group' compares three reporting methods with icons. The individual icon shows a single person, representing a single NPI tied to a single TIN. The group icon depicts multiple people,
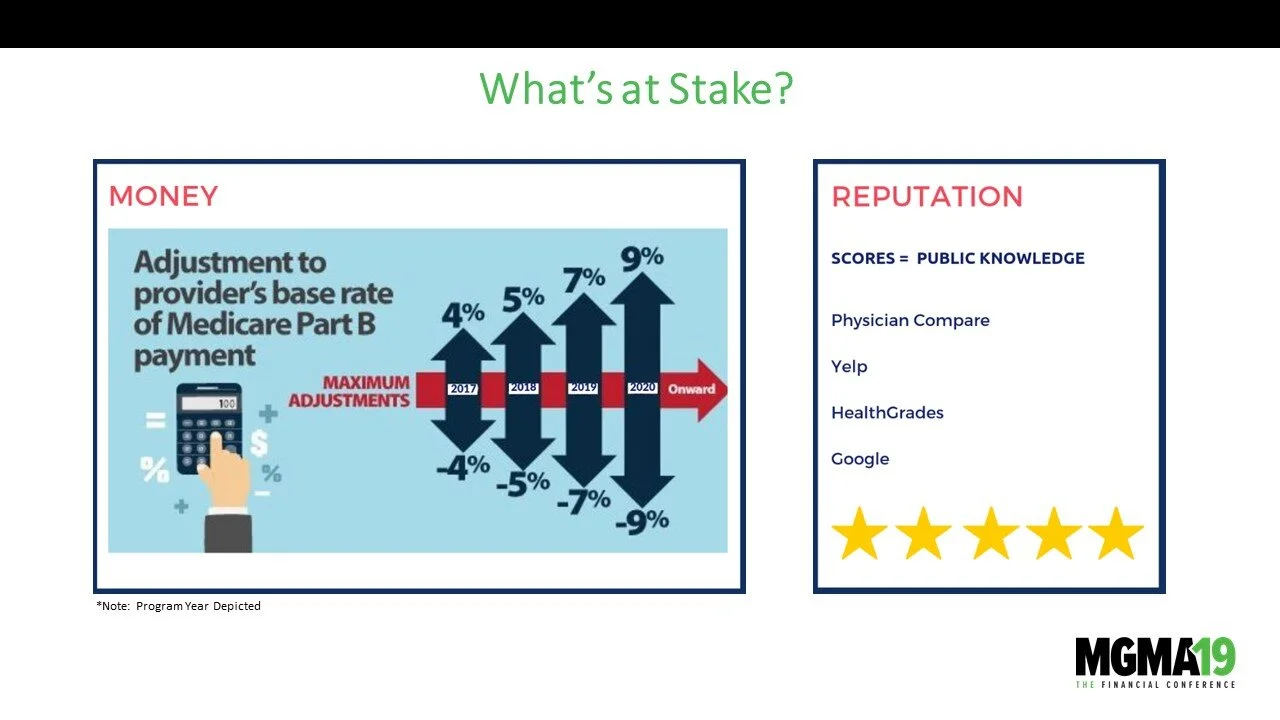
An infographic showing the impact of Medicare Part B provider base rate adjustments on money and reputation from 2017 to 2020 and onward. Money section displays percentages from -4% to 9%. Reputation section has a five-star rating with several exampl
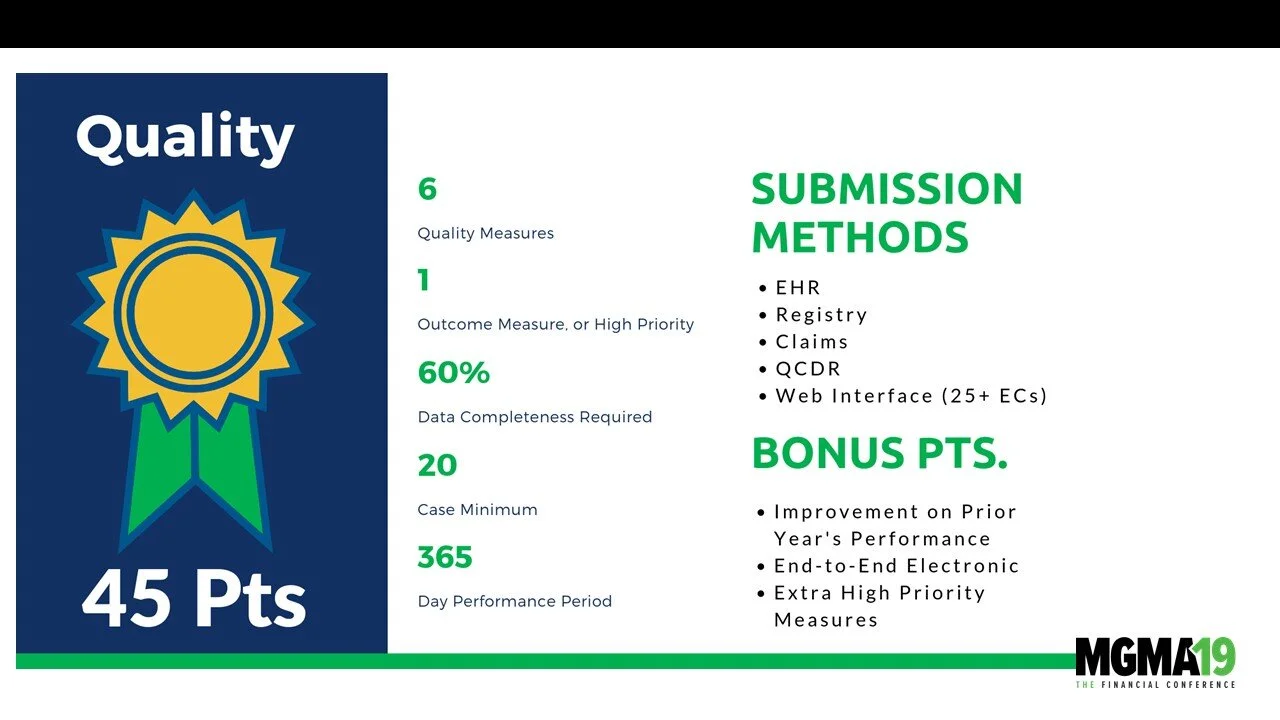
Presentation slide with a blue background and a yellow ribbon icon on the left. Text on the slide includes 'Quality 45 Pts', six quality measures, one outcome measure, 60% data completeness, 20 case minimum, and 365 days. On the right, green headings
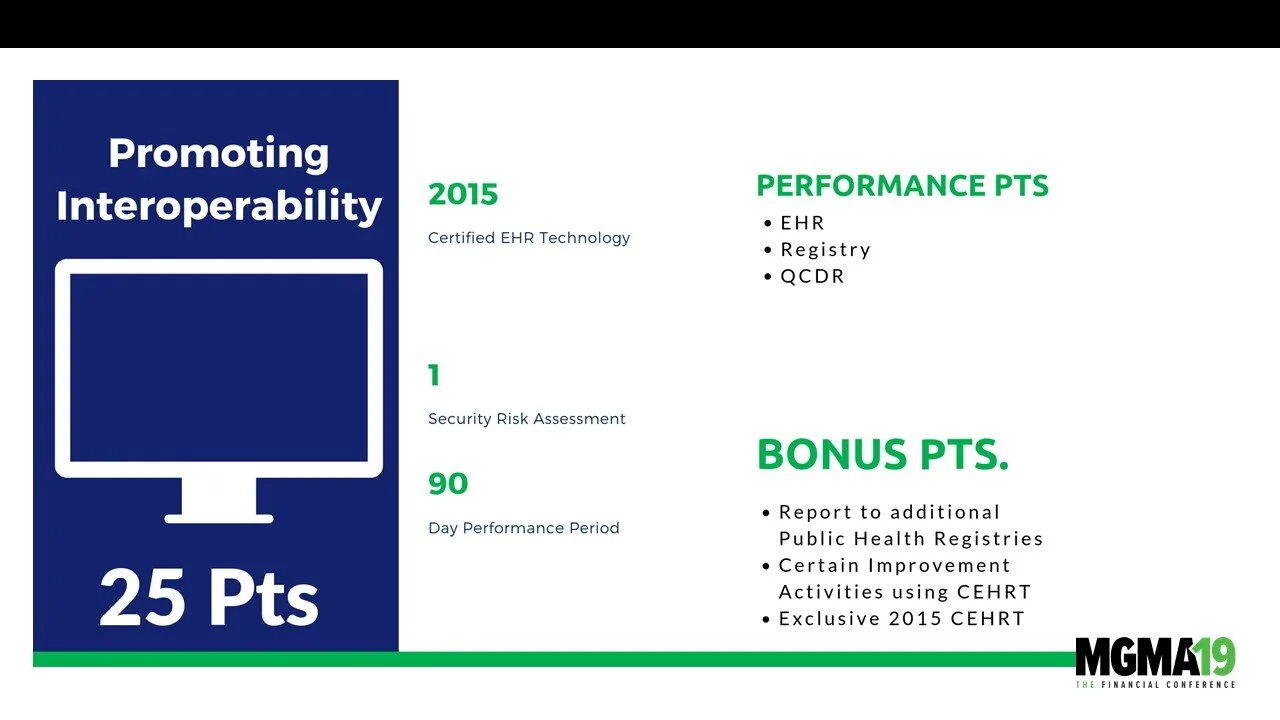
An infographic titled "Promoting Interoperability" highlighting 2015 achievements including certified EHR technology, security risk assessment, and 90-day performance period. It also lists performance points like EHR, registry, and QCDR, plus bonus p
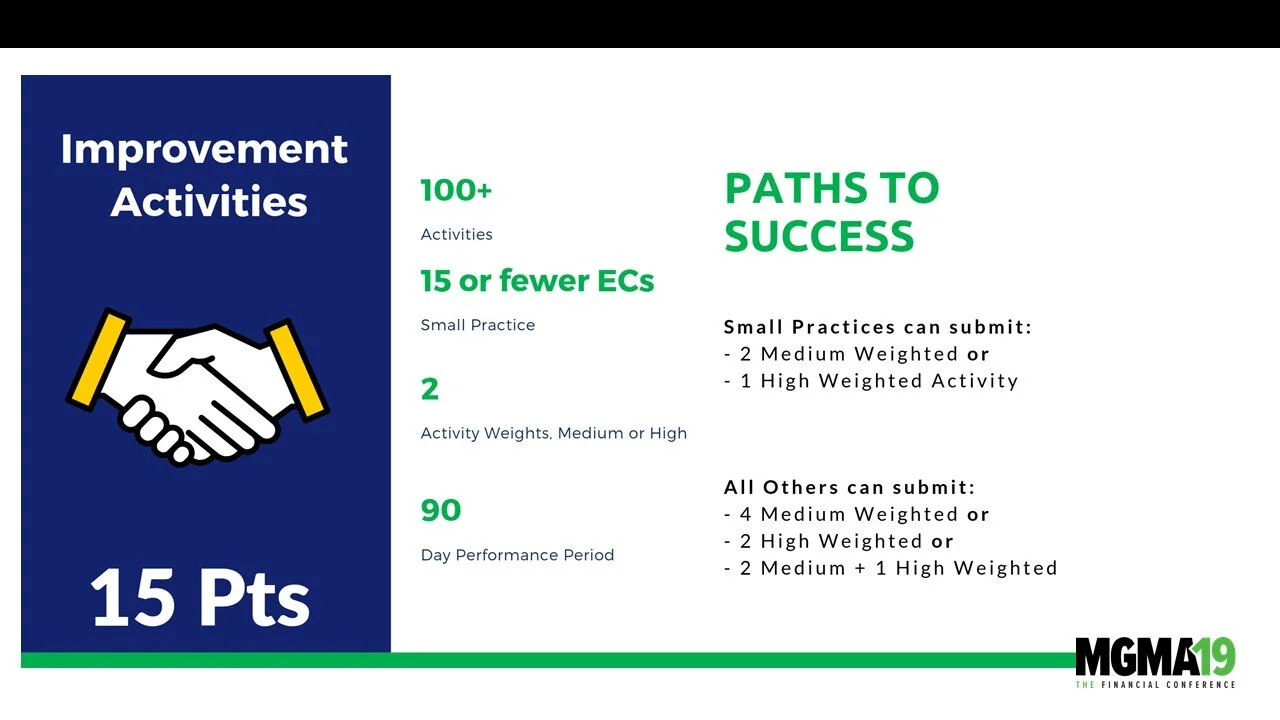
Slide titled 'Improvement Activities' with a handshake graphic. Lists eligibility criteria for activities: 100+ activities, 15 or fewer ECs, 2 activity weights (medium or high), 90 day performance period. Criteria for submitting small practices and o
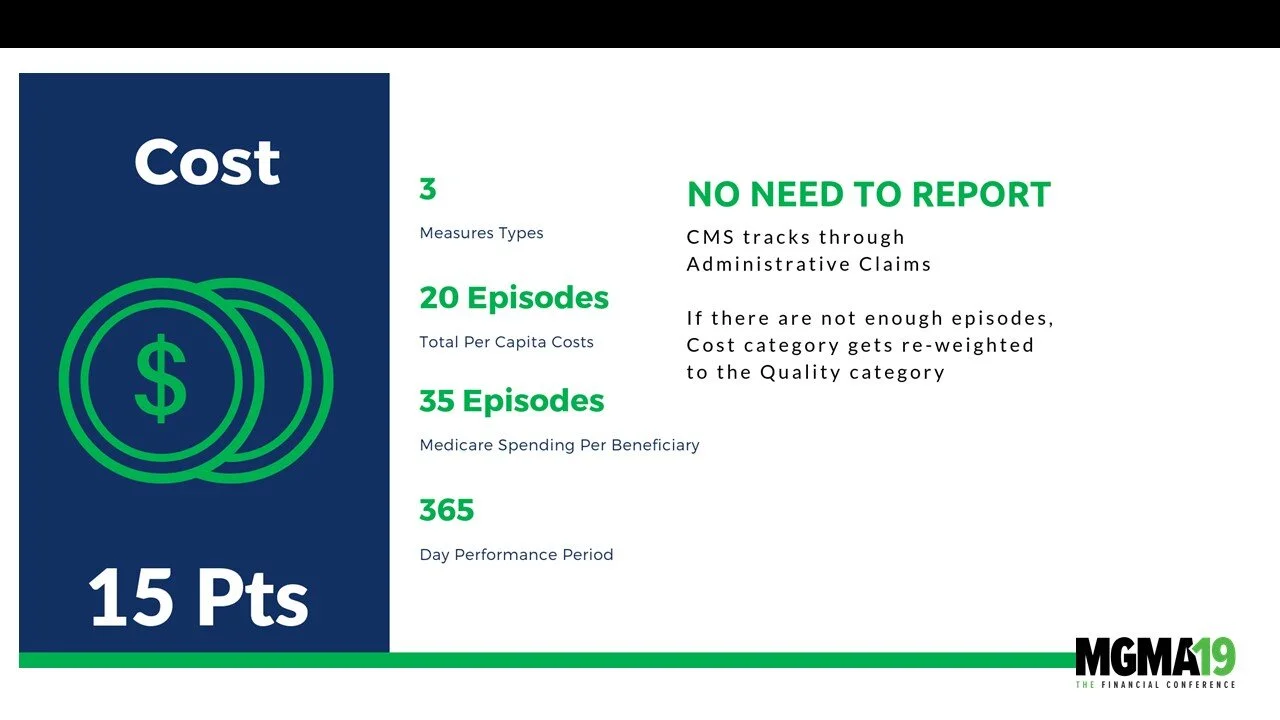
An infographic presentation slide highlighting cost-related information. It mentions three measures, twenty episodes, thirty-five episodes, and a 365-day performance period. It states that there is no need to report administrative claims if episodes
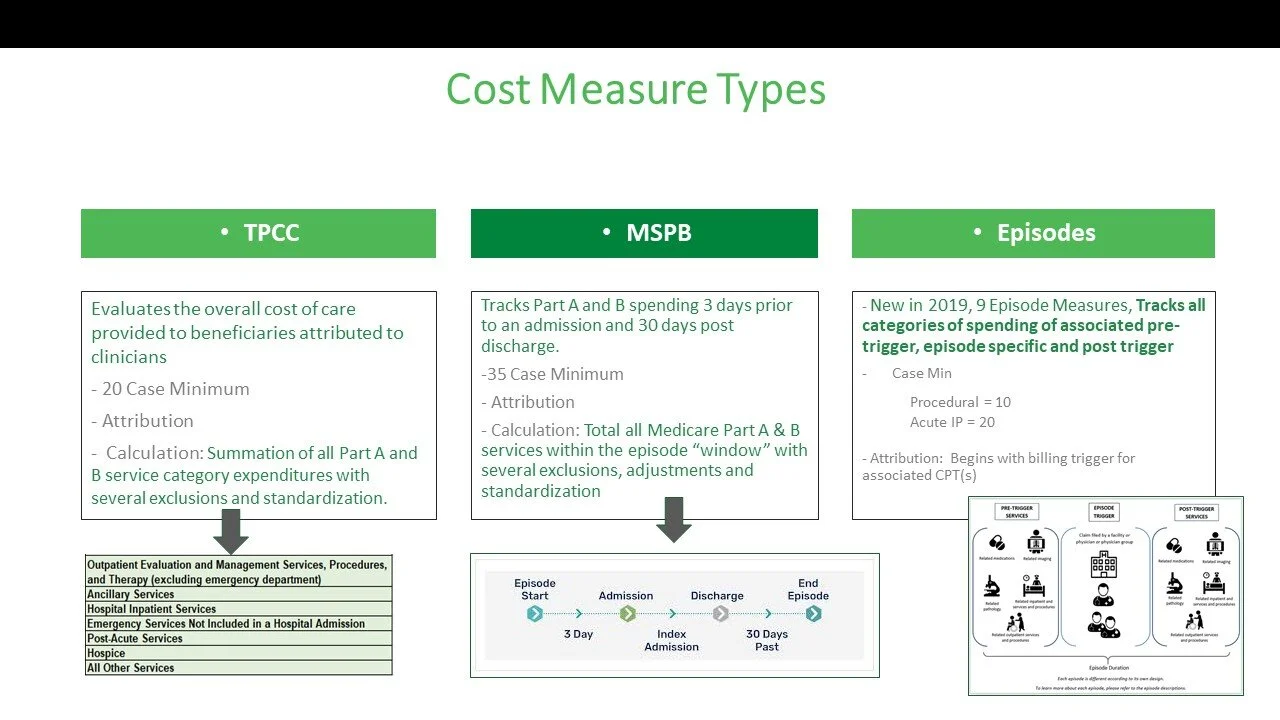
A chart titled 'Cost Measure Types' displaying three categories: TPCC, MSPB, and Episodes, with detailed descriptions and criteria for each measure type.
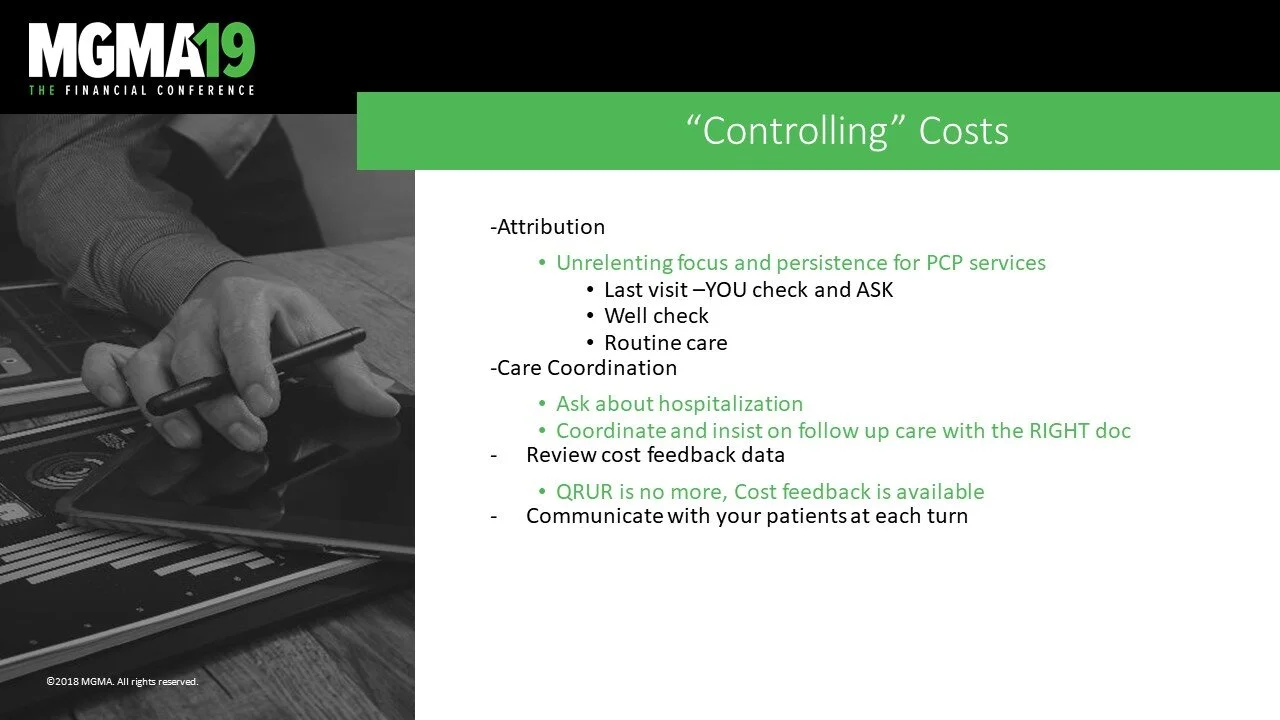
Slide from a presentation at MGMA 2019 titled "Controlling Costs," discussing attribution, care coordination, reviewing cost feedback data, and communicating with patients.
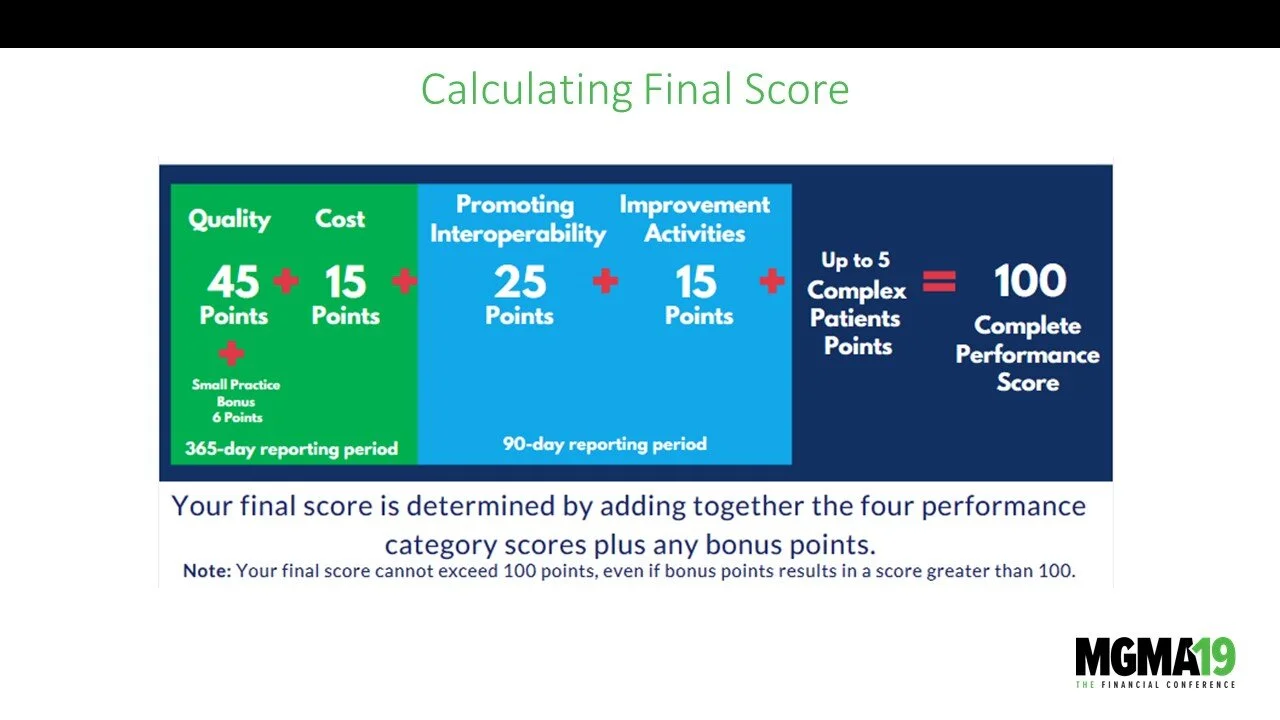
A chart showing how to calculate a final score out of 100 points by adding four performance category scores with bonus points. The categories include Quality, Cost, Promoting Interoperability, and Improvement Activities, each with specific points and
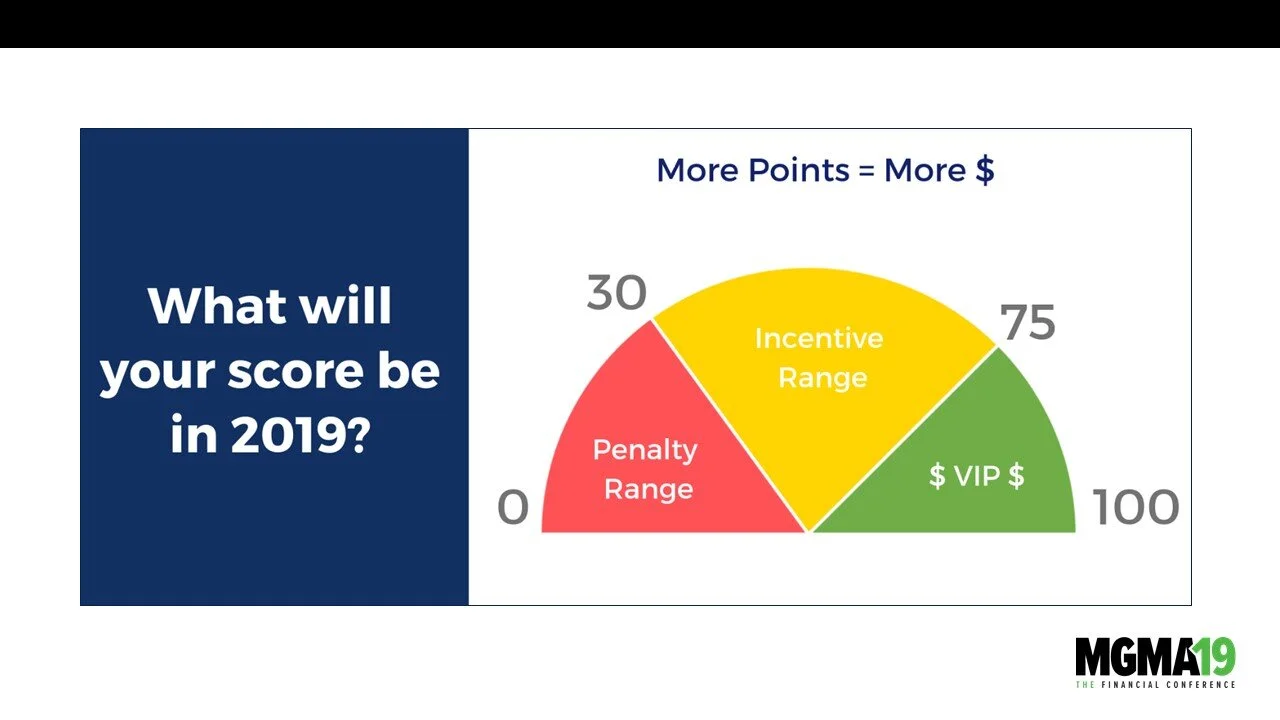
A gauge-style chart illustrating a score range for 2019 with segments in red, yellow, and green, labeled Penalty Range, Incentive Range, and VIP, respectively, with values from 0 to 100 and a title asking, 'What will your score be in 2019?' The chart
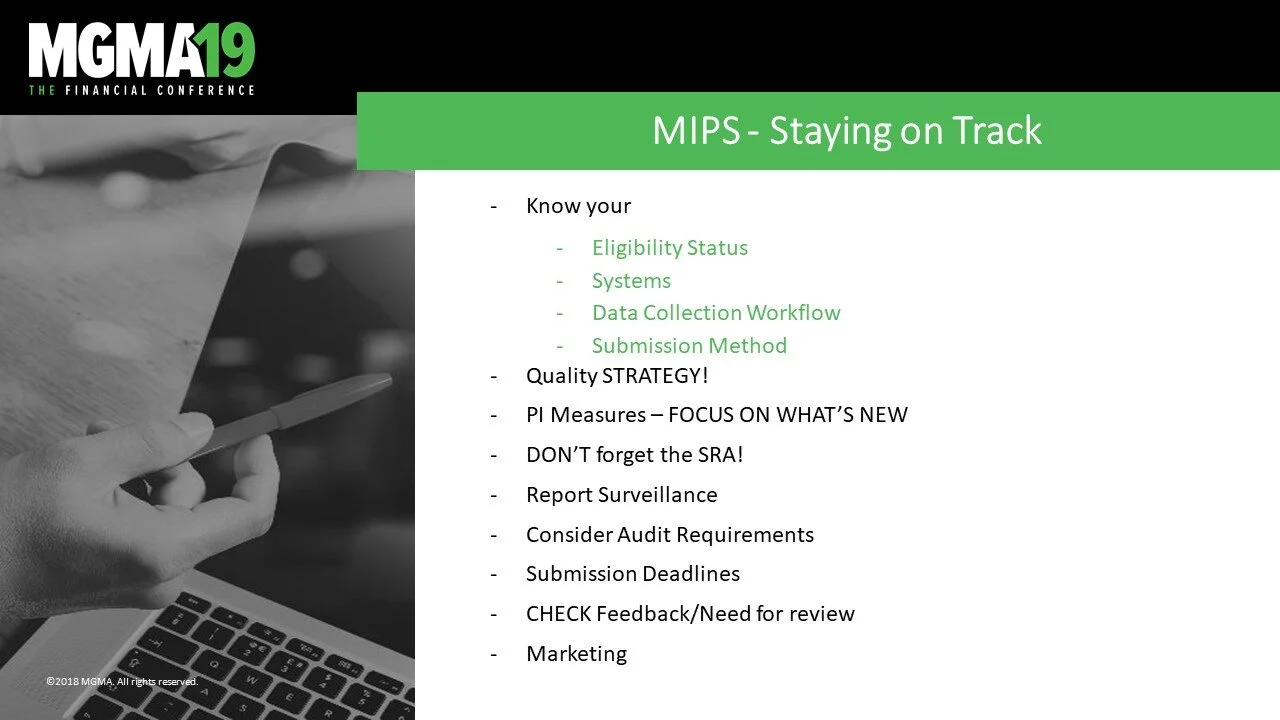
Slide from a presentation at MGMA 19 conference titled 'MIPS - Staying on Track' with bullet points about MIPS compliance and processes, including knowing your eligibility status, systems, data collection, submission method, quality strategy, PI meas
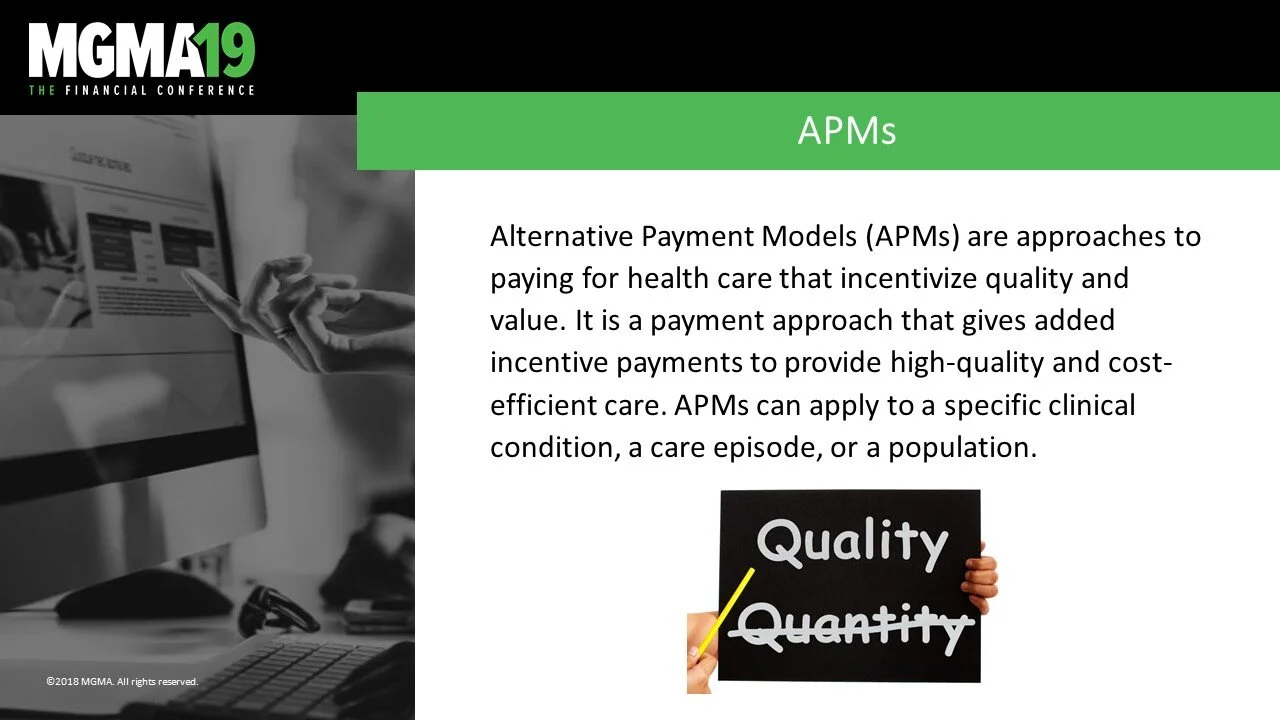
Slide from MGMA19 conference presentation explaining Alternative Payment Models (APMs), with a black and white image of a person using a tablet on the left, and a hand holding a sign with the words 'Quality' and 'Quantity' on the right.
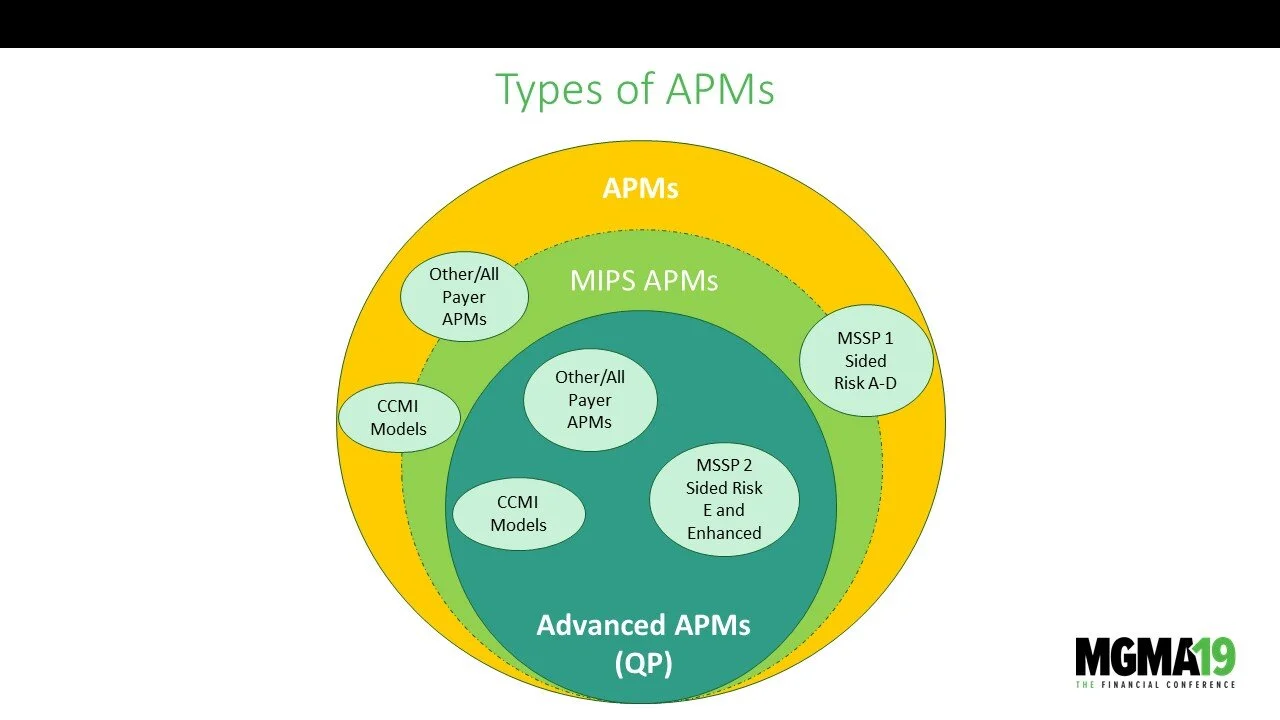
Diagram showing types of APMs, including MIPS, Advanced, and All Payer APMS, with related subcategories and models.
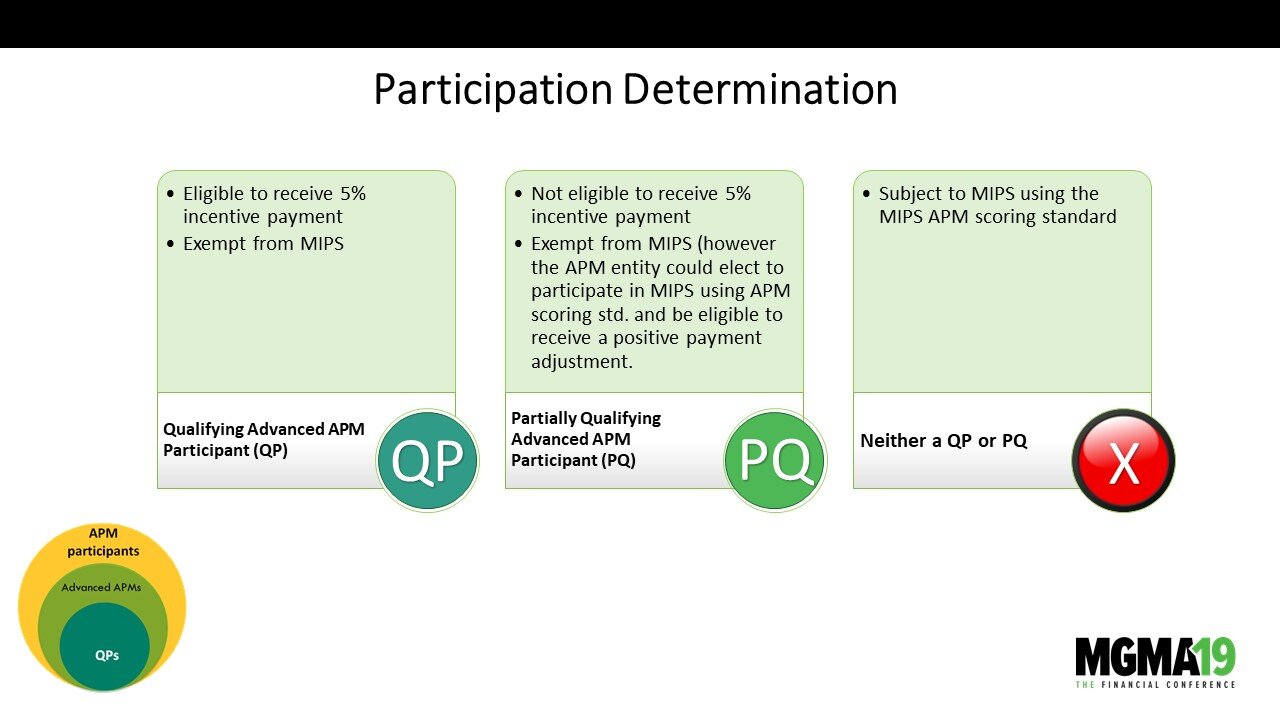
Diagram explaining participation determination criteria with three columns: qualifying advanced APM participant (QP), partially qualifying advanced APM participant (PQ), and neither QP nor PQ. The diagram includes text describing eligibility and scor
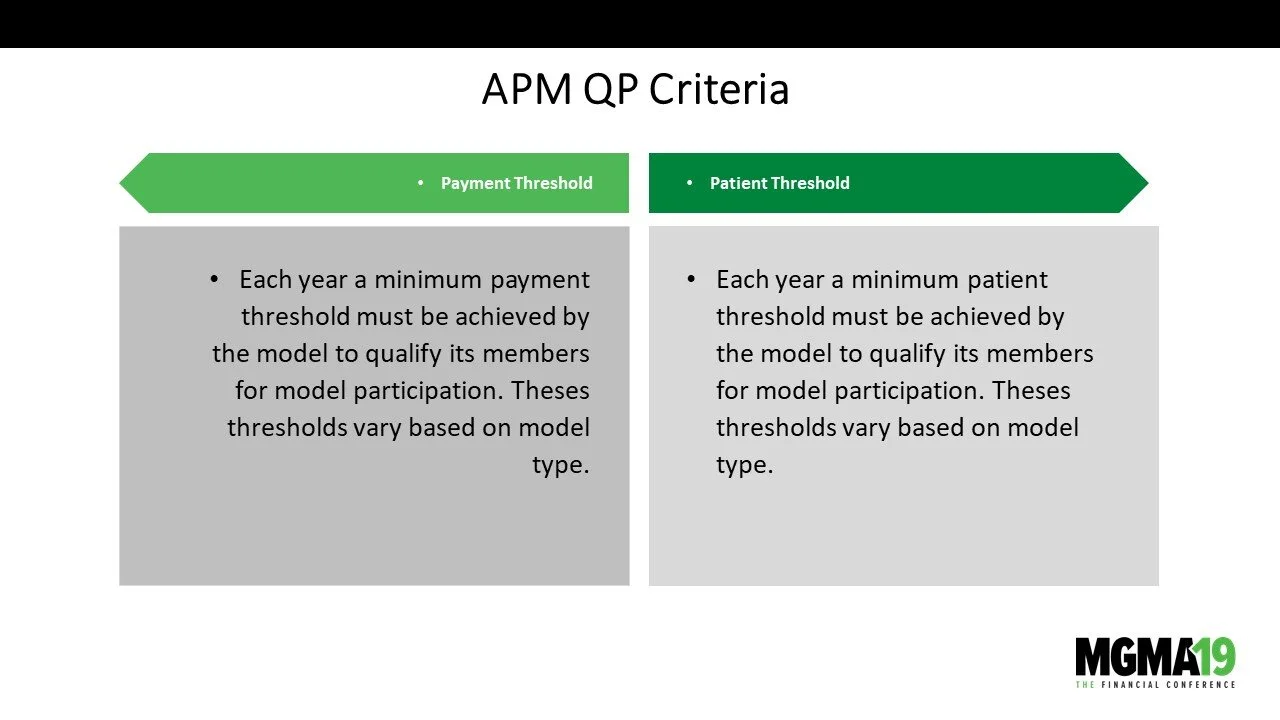
Slide titled "APM QP Criteria" with two sections: Payment Threshold and Patient Threshold, describing annual minimum payment and patient thresholds for model participation, featuring the MGMA19 conference logo at the bottom right.
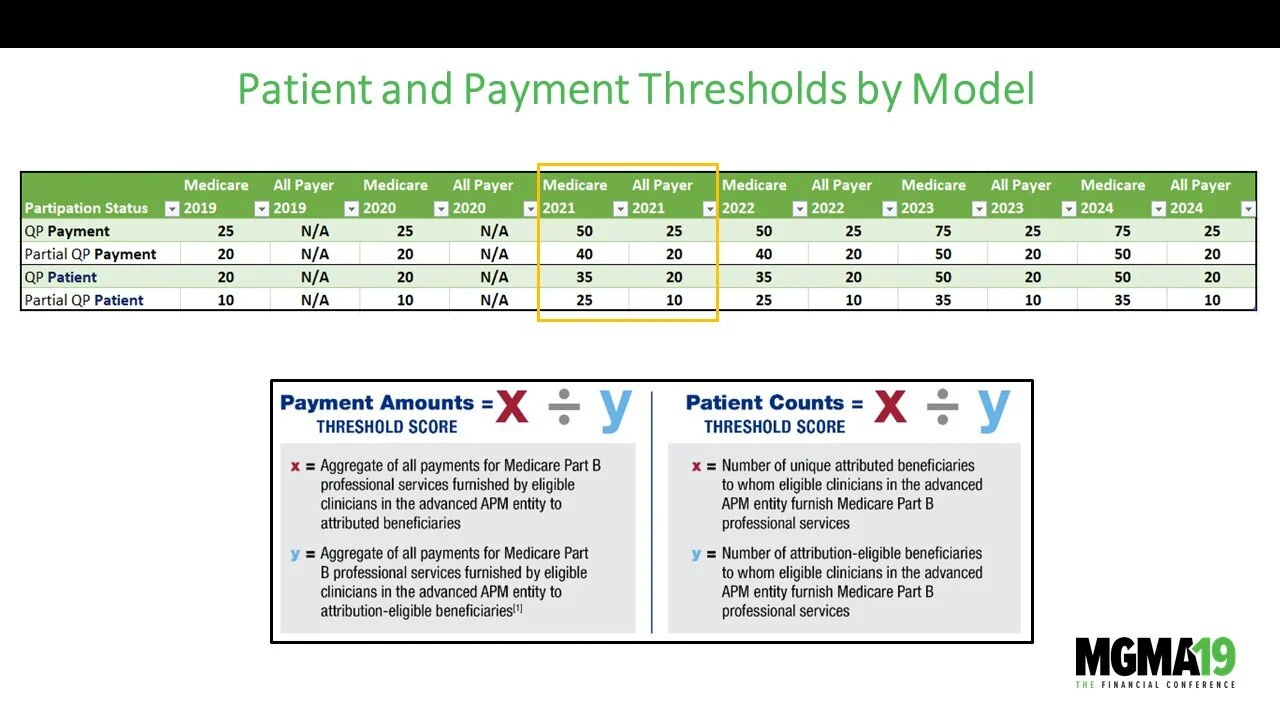
Table showing patient and payment thresholds for different Medicare and All Payer models from 2019 to 2024. Includes categories for QP Payment, Partial QP Payment, QP Patient, and Partial QP Patient with respective threshold amounts.
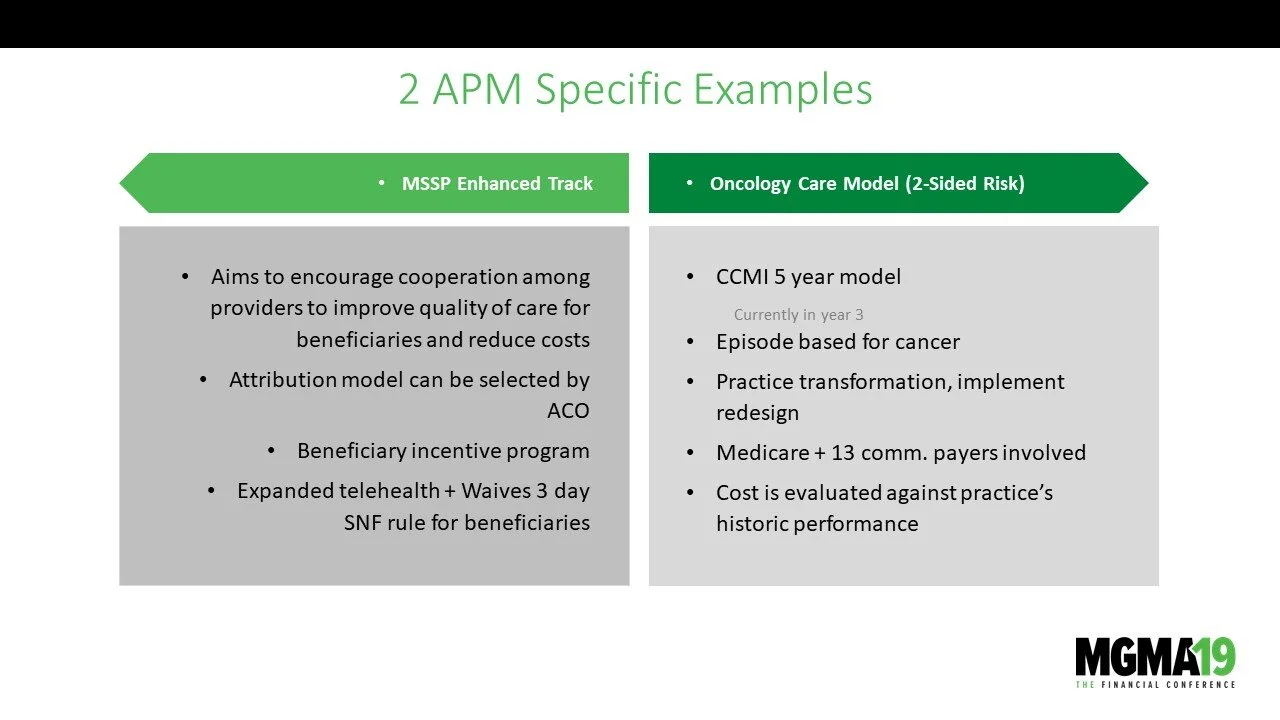
Slide titled '2 APM Specific Examples' with two sections. The left section is titled 'MSSP Enhanced Track' and lists aims to encourage cooperation, attribution model, beneficiary incentive, and expanded telehealth. The right section is titled 'Oncolo
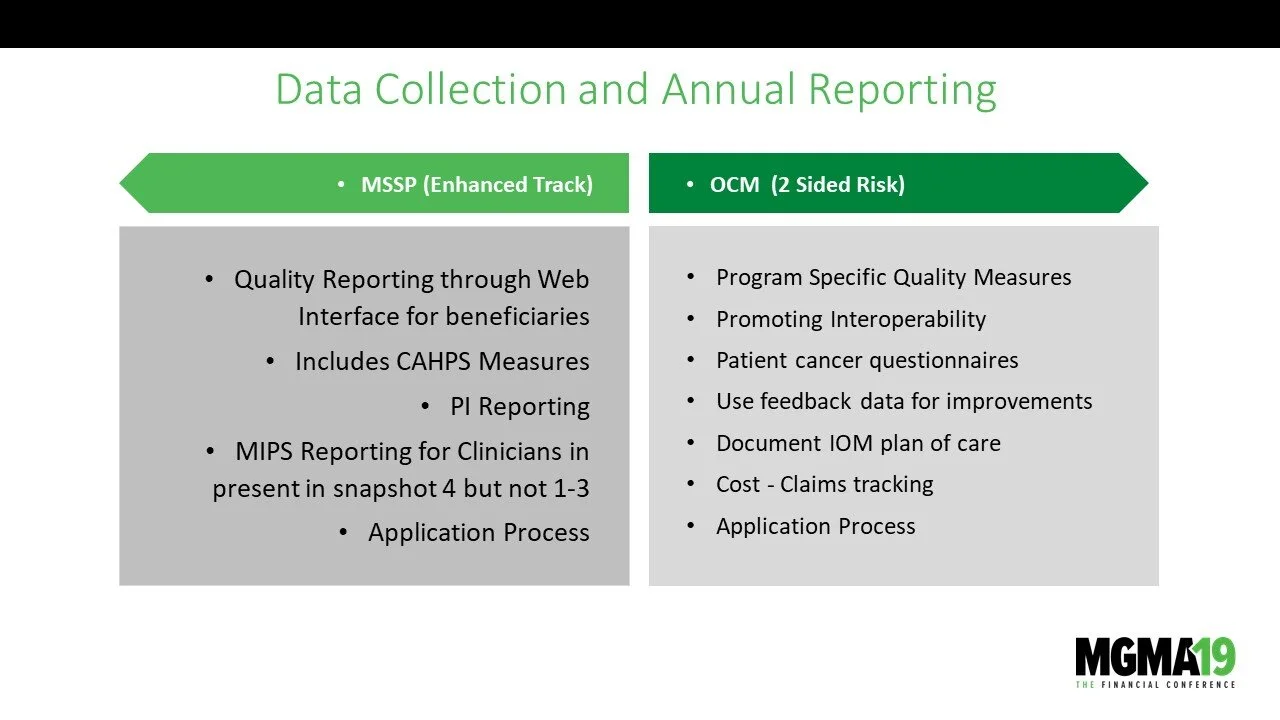
Slide titled 'Data Collection and Annual Reporting' with two sections: 'MSSP (Enhanced Track)' on the left and 'OCM (2 Sided Risk)' on the right. The MSSP section lists benefits like web-based quality reporting, inclusion of CAHPS measures, PI report
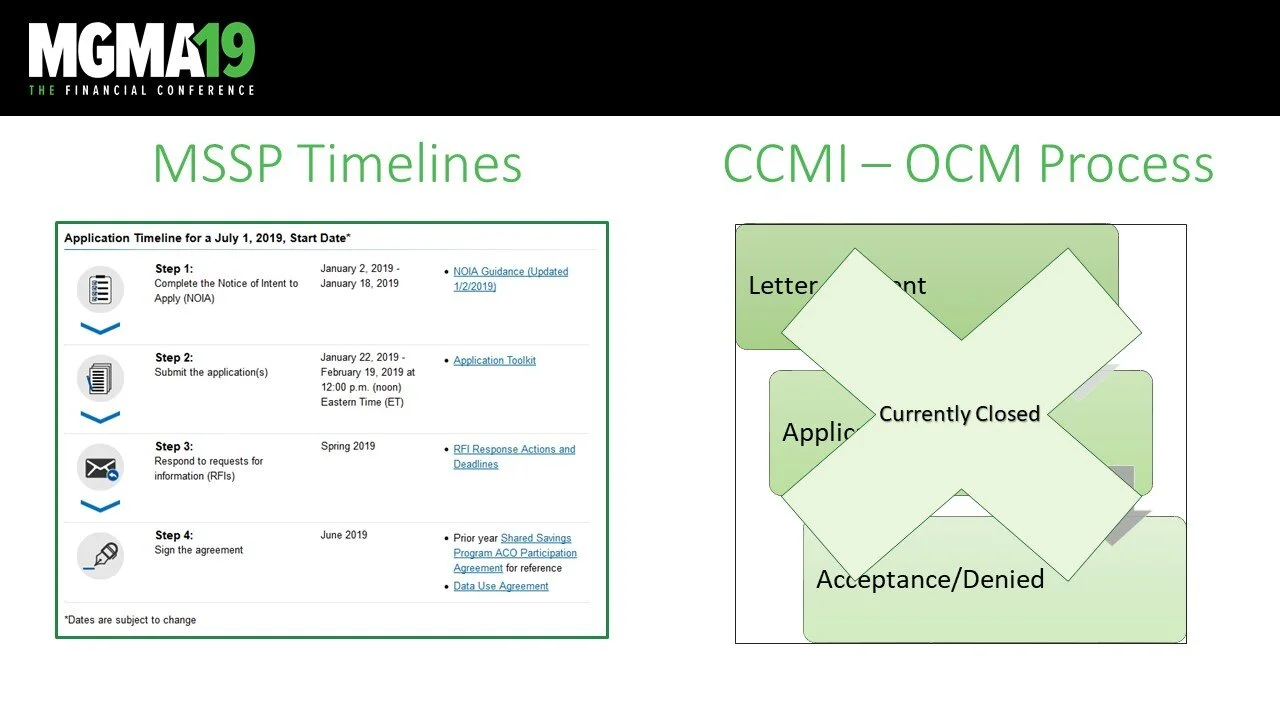
Slide showing MGMA19 conference presentation with MSSP application timelines on the left and CCI-OCM process flow on the right. The flowchart indicates the letter sent, application, and acceptance or denial, currently marked as closed.
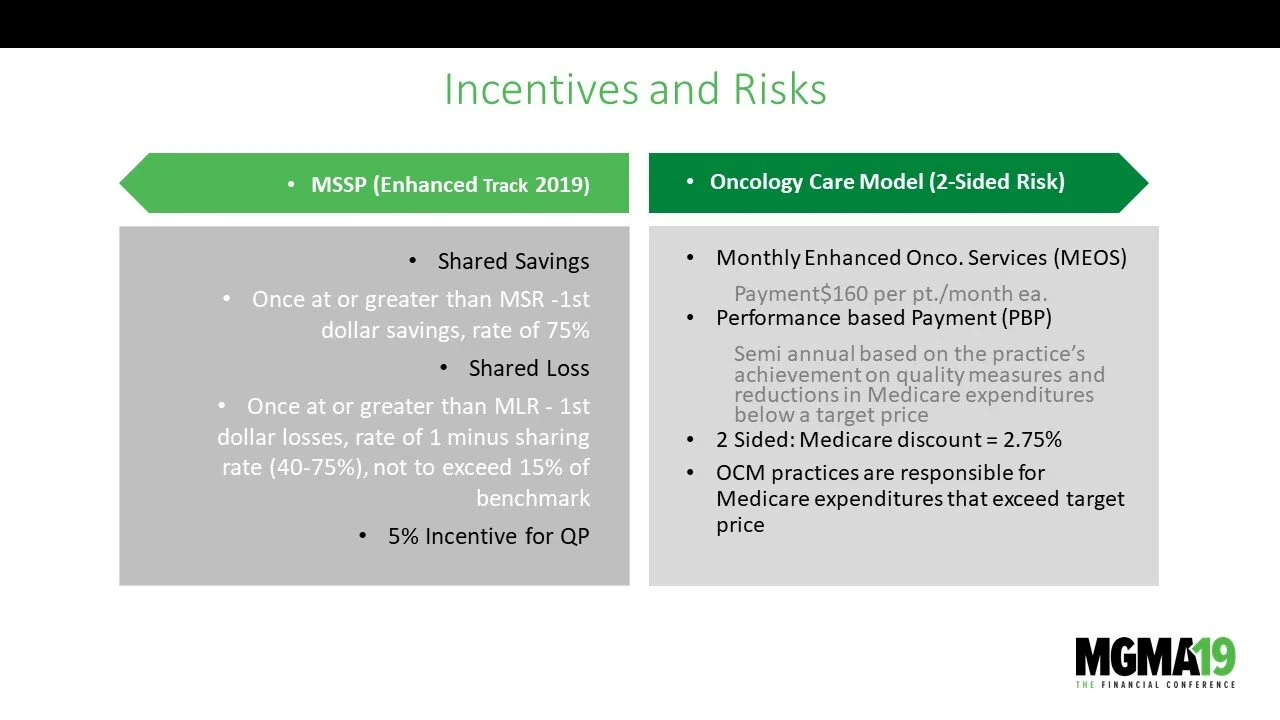
A PowerPoint slide titled "Incentives and Risks" with two sections. The left section titled "MSSP (Enhanced Track 2019)" details shared savings, shared loss, and a 5% incentive for QP. The right section titled "Oncology Care Model (2-Sided Risk)" men
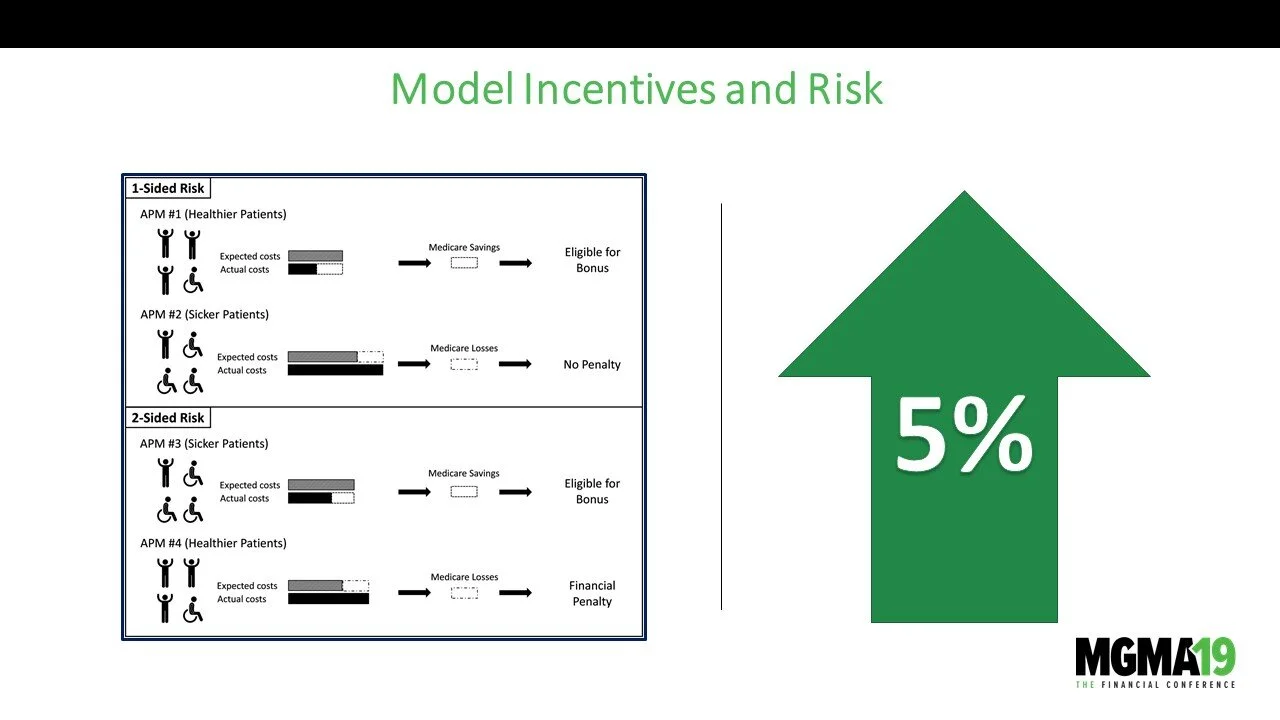
Diagram showing model incentives and risk, with two sections: one-sided risk and two-sided risk. Each section explains incentives for different patient groups with costs and savings, indicating eligibility for bonuses or penalties. A large green arro
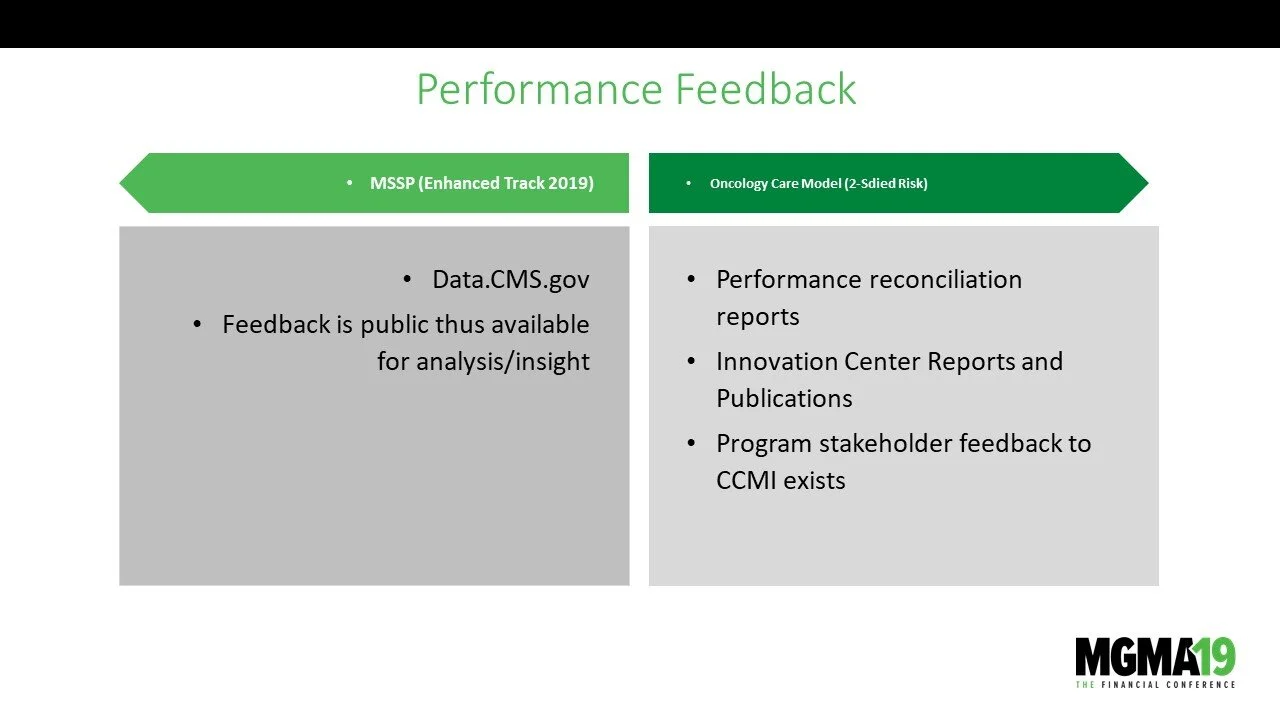
Slide titled 'Performance Feedback' with two columns. The left column has a green arrow with 'MSSP (Enhanced Track 2019)', and the right has a green arrow with 'Oncology Care Model (2-Sided Risk)'. The left column lists 'Data.CMS.gov', 'Feedback is p
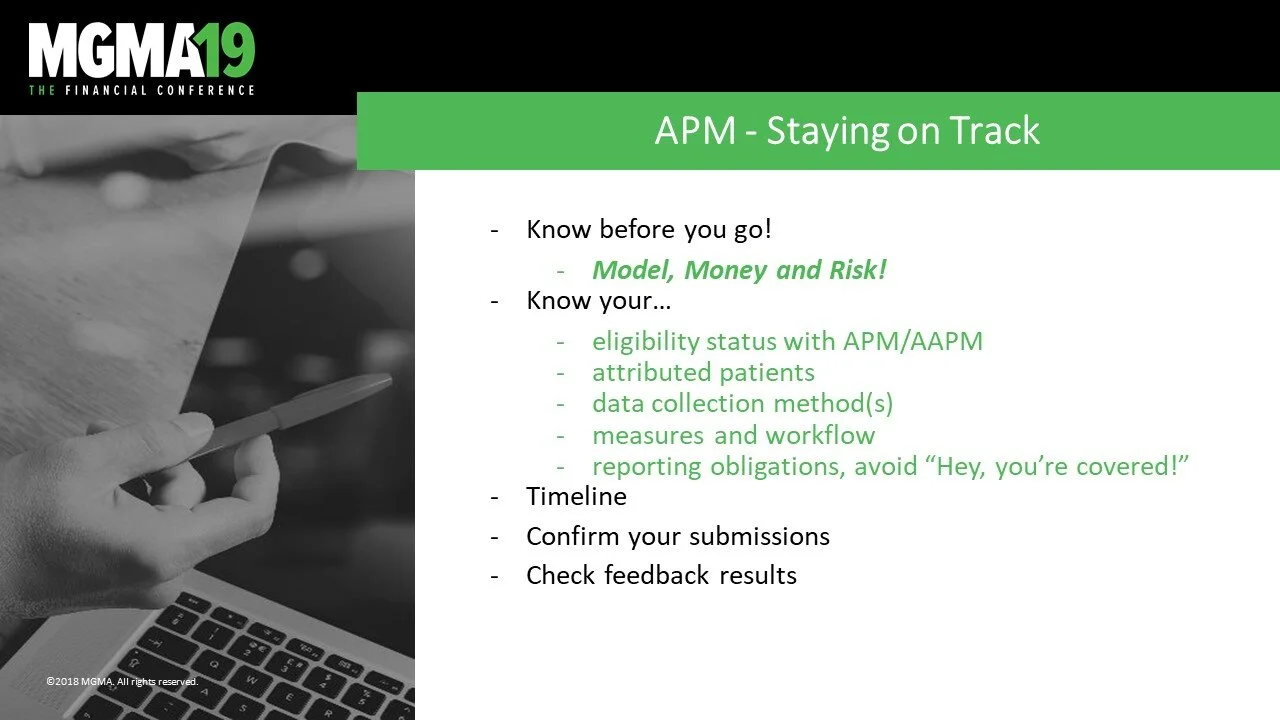
Slide from a presentation titled 'APM - Staying on Track' at MGMA 19 conference. The slide contains bullet points about staying on track with APM, including understanding eligibility status, data collection, reporting obligations, and confirming subm
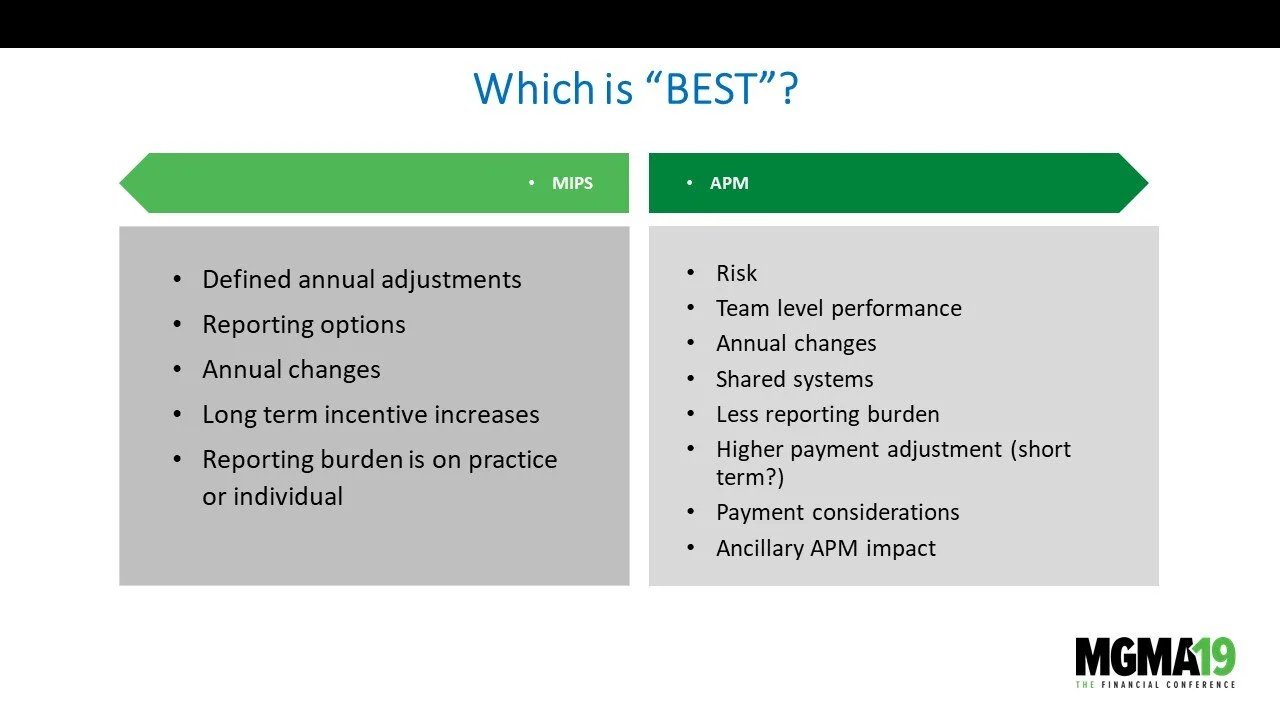
Comparison table titled 'Which is BEST?' with two columns labeled 'MIPS' and 'APM'. The MIPS column lists features such as defined annual adjustments, reporting options, annual changes, long-term incentive increases, and reporting burden on practice
A person appears to be asking questions during a conference, with an audience visible in the background. The text 'Q + A' is centered on the image in green, and the logo in the bottom right corner reads 'MGMA19 The Financial Conference'.

(888) 647-7247 | hello@chirpybirdinc.com